Agricultural Analysis
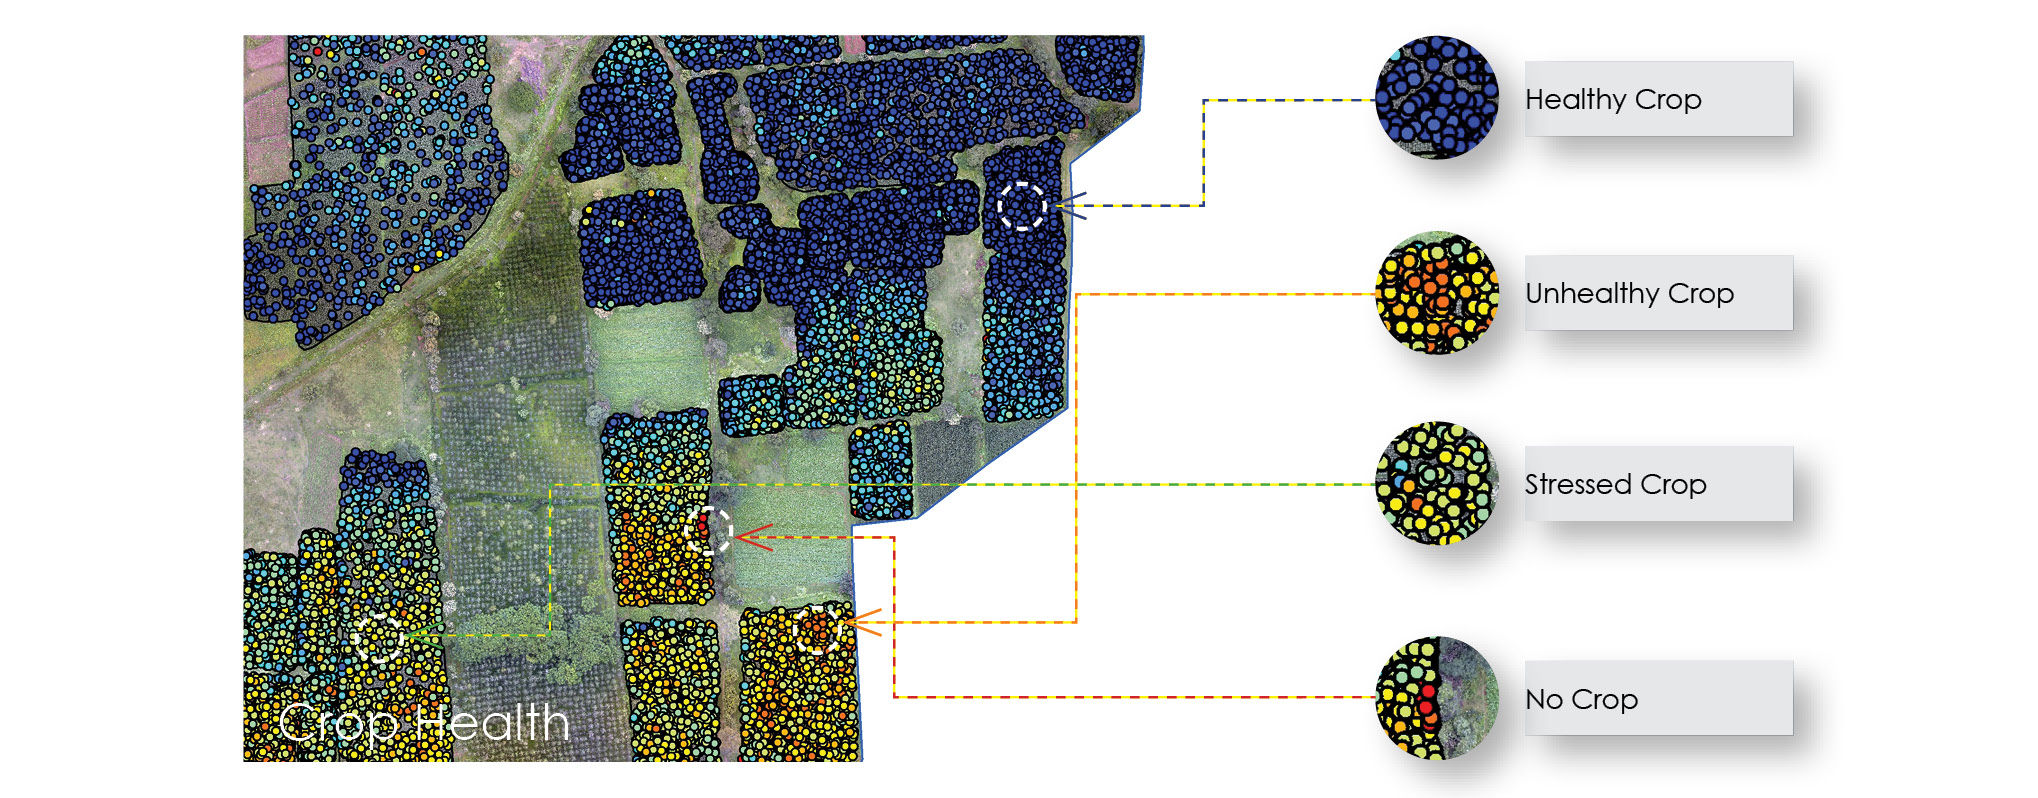
Crop Health Map
An overlay map is generated to simplify the analysis of crop health data, providing a clear overview of the site. It incorporates points on the map that carry essential information about crop health, along with accurate pinpoint location data with an impressive accuracy of approximately 3 centimeters. The overlay map serves as a valuable tool for assessing and monitoring the health of crops. It offers a visual representation of the entire agricultural area, enabling quick identification of areas that may require attention or intervention. By examining the points on the map, farmers and agricultural experts can easily understand the overall condition of their crops and make informed decisions accordingly.
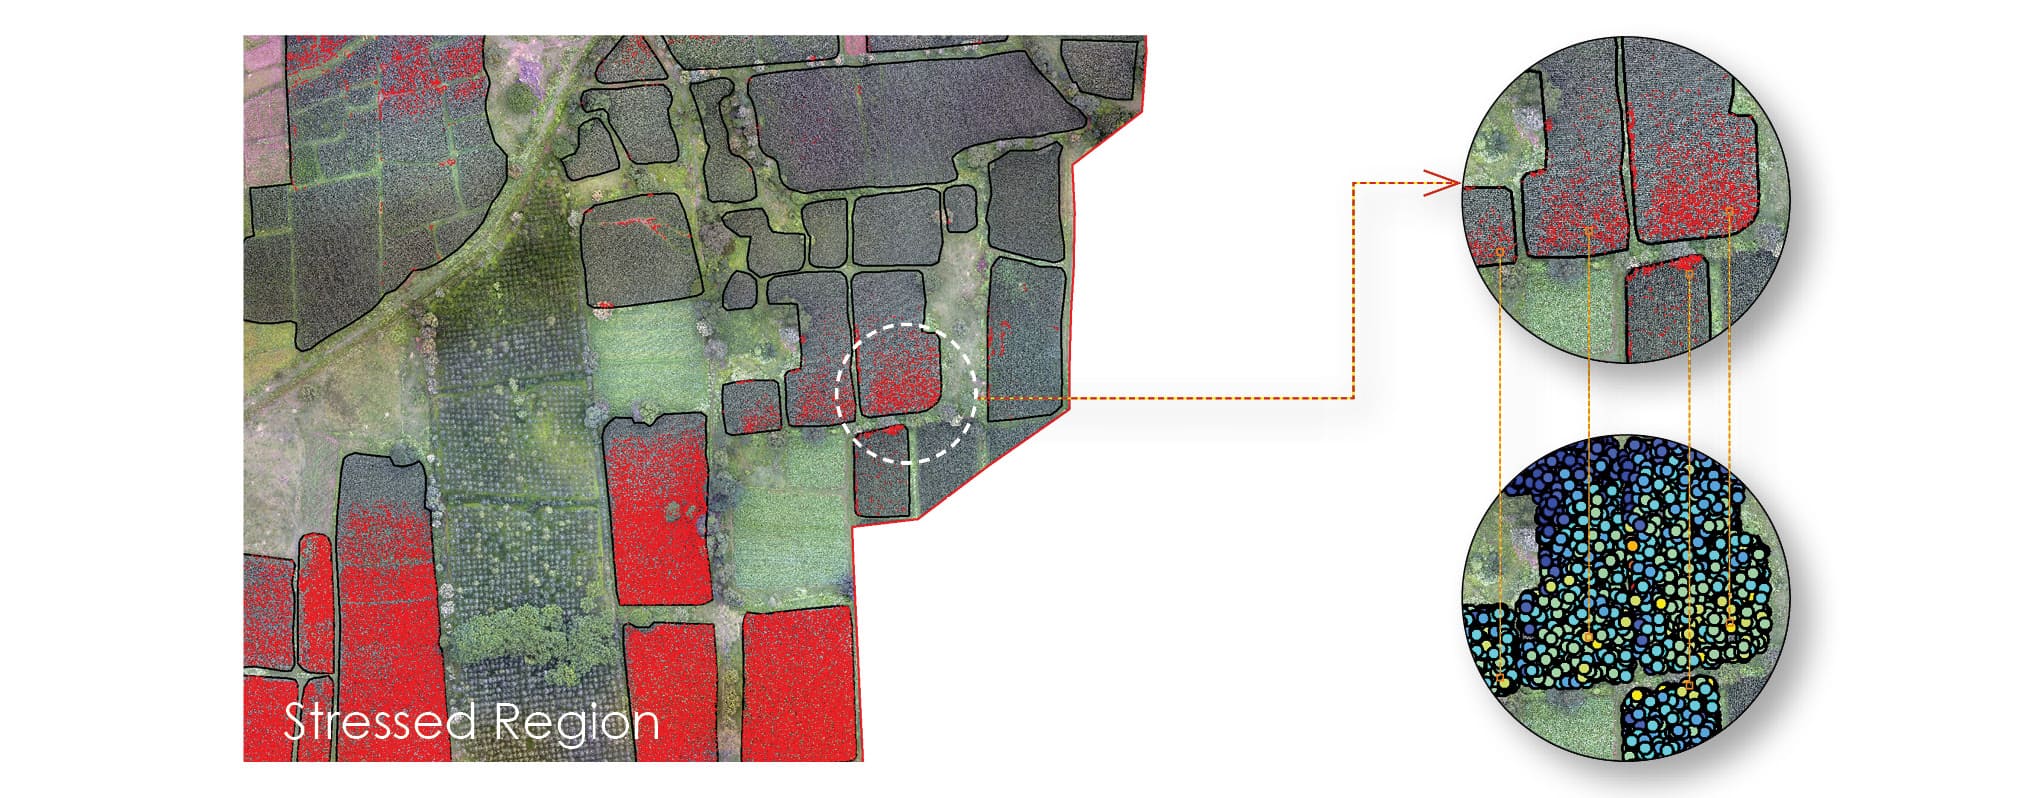
Stressed Crop Region
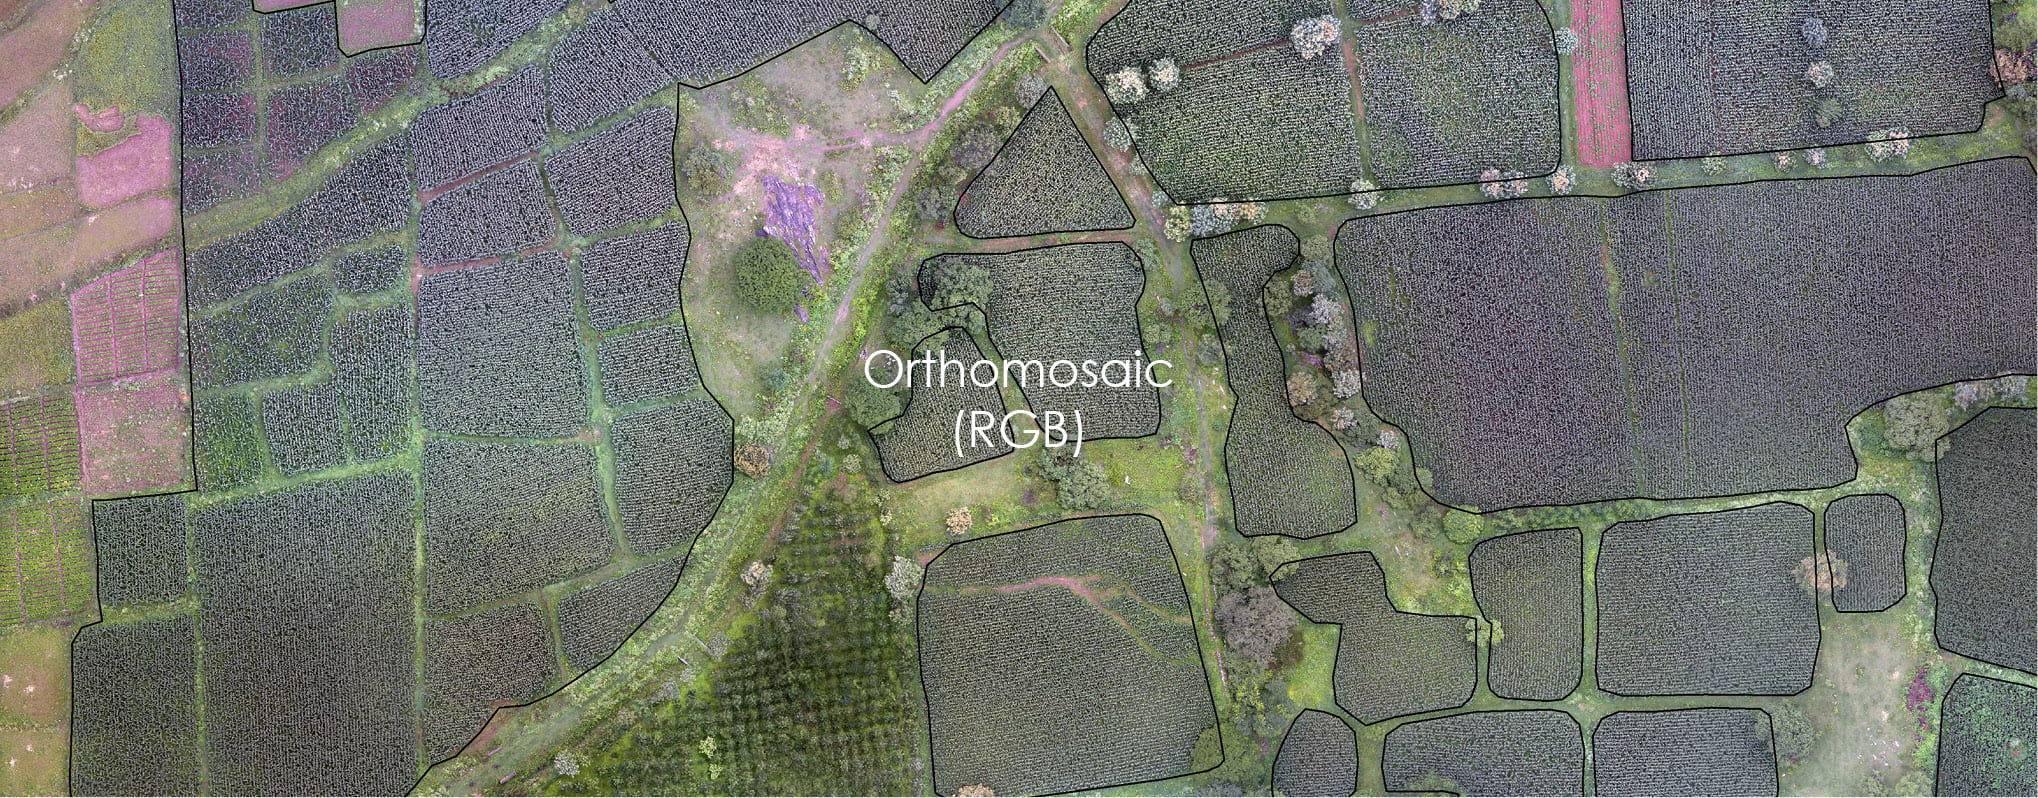
An orthomosaic is a detailed, high-resolution image of an area created by stitching together multiple aerial or satellite photographs. It is typically generated using specialized software that combines the individual images, correcting for distortions and aligning them to create a seamless, georeferenced representation of the landscape.
Orthomosaic
To identify the area of the stressed crop region the random points with the NDVI index values are used. The points indicating the stressed region are extracted and given a buffer of 0.3m (1 ft). From the Orthomosaic, the plant covering radius if 0.3m is observed. These generated buffers are merged to avoid overlaps and miscalculations and generate a crisp area of stressed crop.
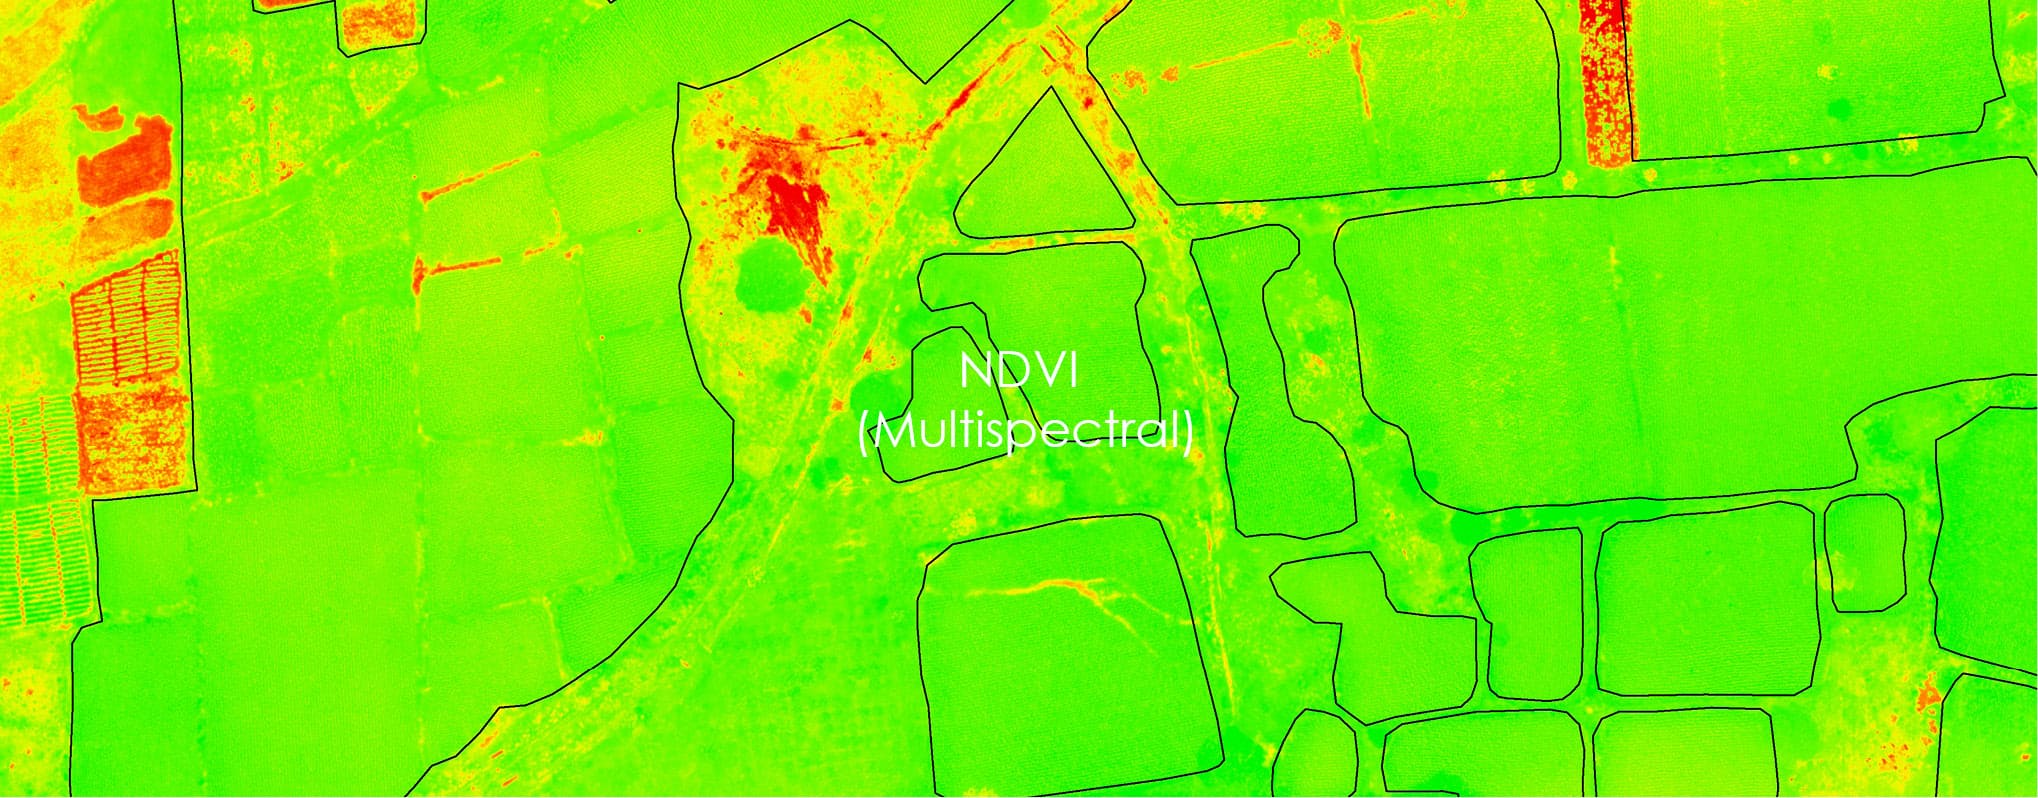
NDVI
NDVI (Normalized Difference Vegetation Index) is a widely used vegetation index in remote sensing. It quantifies vegetation health using near-infrared and red light reflectance values. NDVI values range from -1 to +1, with higher values indicating healthier vegetation and lower values indicating sparse or stressed vegetation. It is used in agriculture, forestry, and environmental monitoring to assess crop health, monitor vegetation growth, and study land cover changes.